App Installation
- Download and Install dependancies, listed in the dependancies section (be sure to follow the install notes for those apps).
- Download the Security Monitoring for Splunk app from Splunkbase
- Install the app on the search head only, either through the UI or via the command line.
Updating from Previous Versions
Dashboard Lookups
Right now, SMFS generates lookups that drive dashboard filters on a pre-determined time scale (nightly), so if you upgrade from a previous version I recommend you take a copy of the lookup files in the lookup directory for the app (security_monitoring_for_splunk/lookups), and overwrite them post upgrade. Be aware, more lookups are added with every version, so be sure to overwrite only specific files and not the entire directory.
This is an enhancement on the list, but right now, this is the work around.
Detection Playbooks
As of version 1.3 the app includes detection searches that are written into the KVStore. There should be no impact between upgrades to existing detection playbooks, however it may be wise to ensure you have a good backup as per any other upgrade procedure.
Configuration
Alert Manager
By far the most important part is to install and configure the alert manager app prior to installing security monitoring for splunk.
Here's how I configured the app, if you haven't read the instructions.
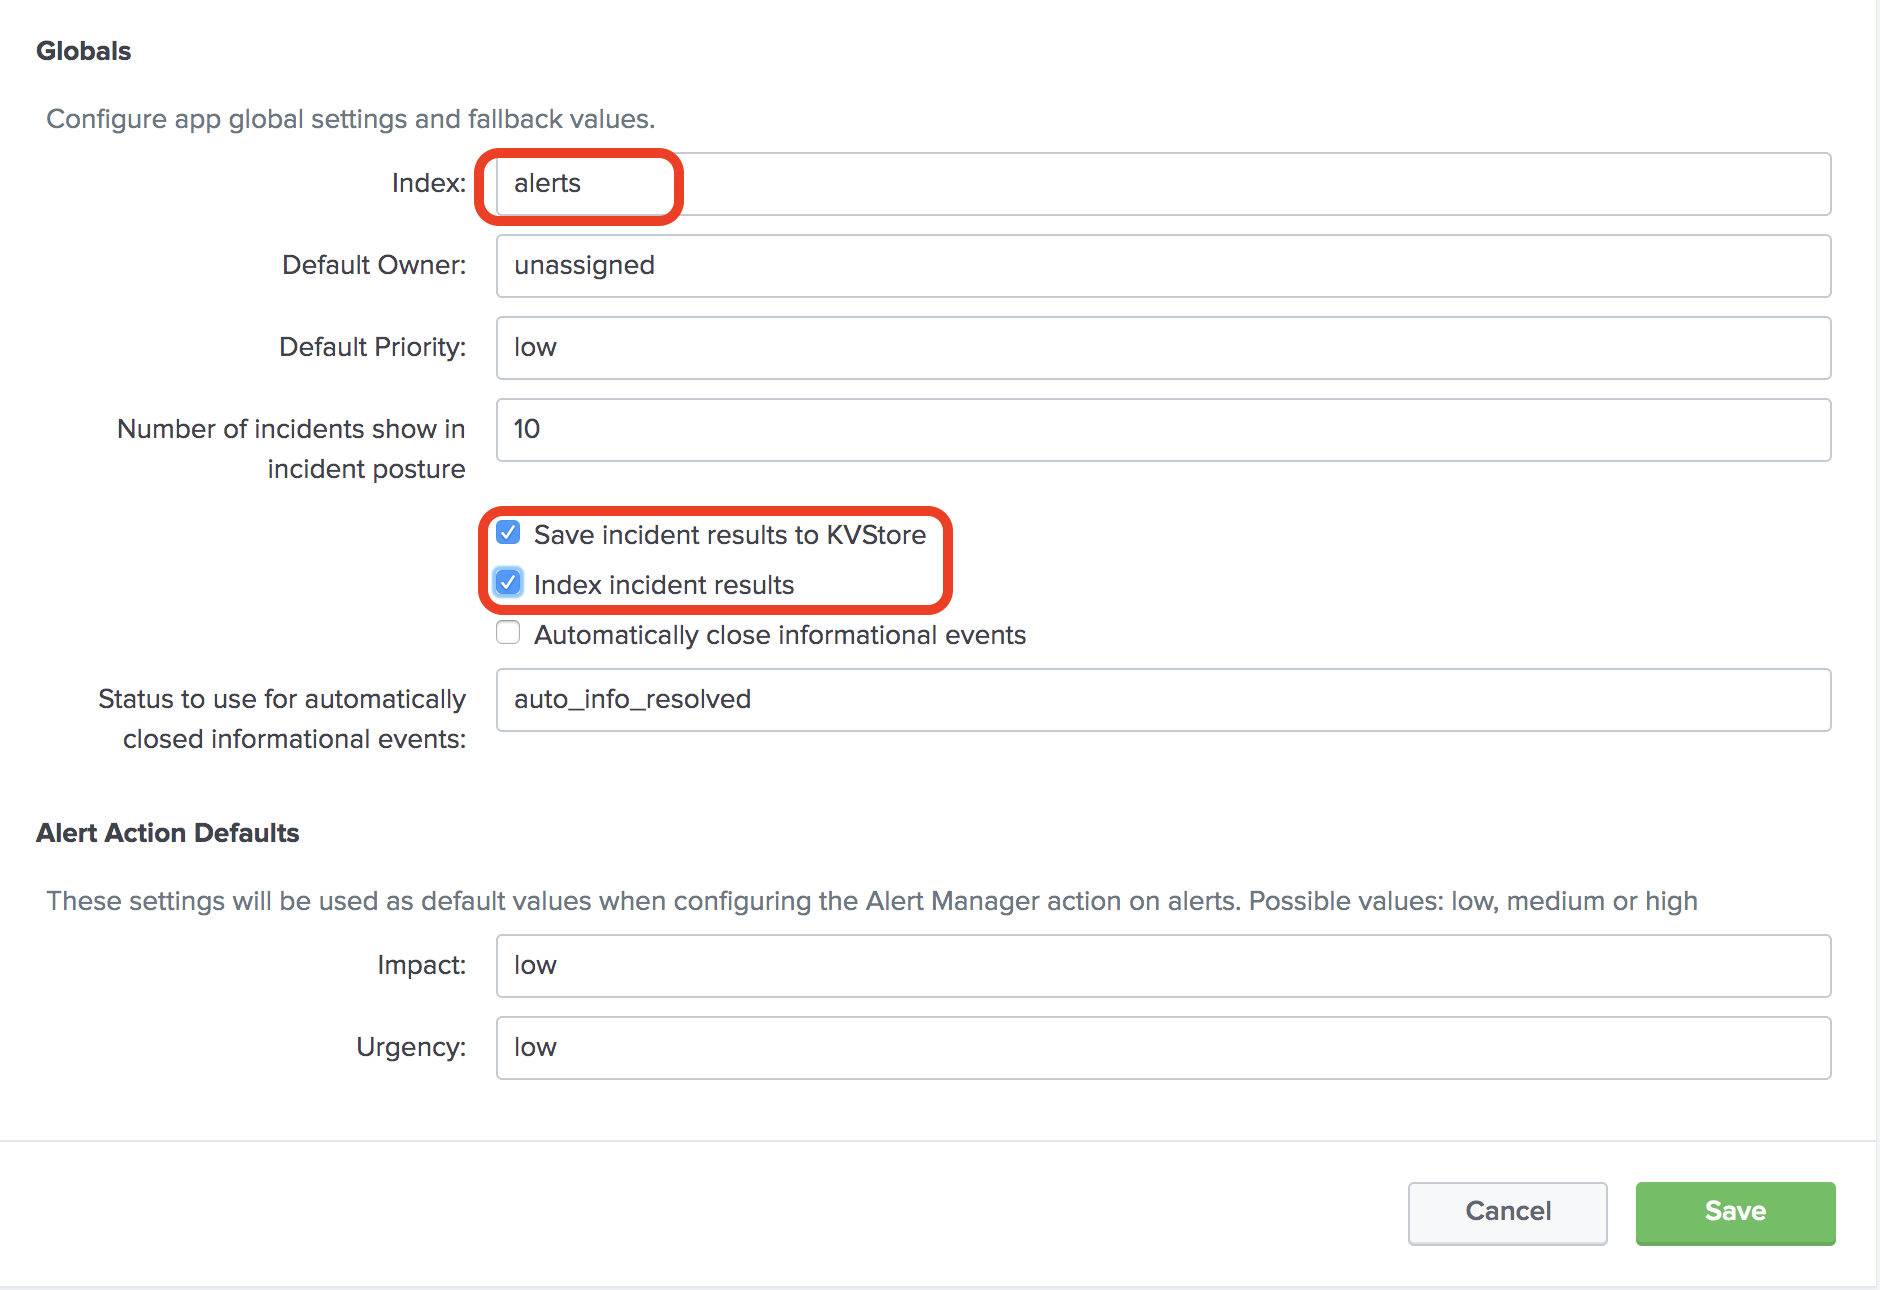
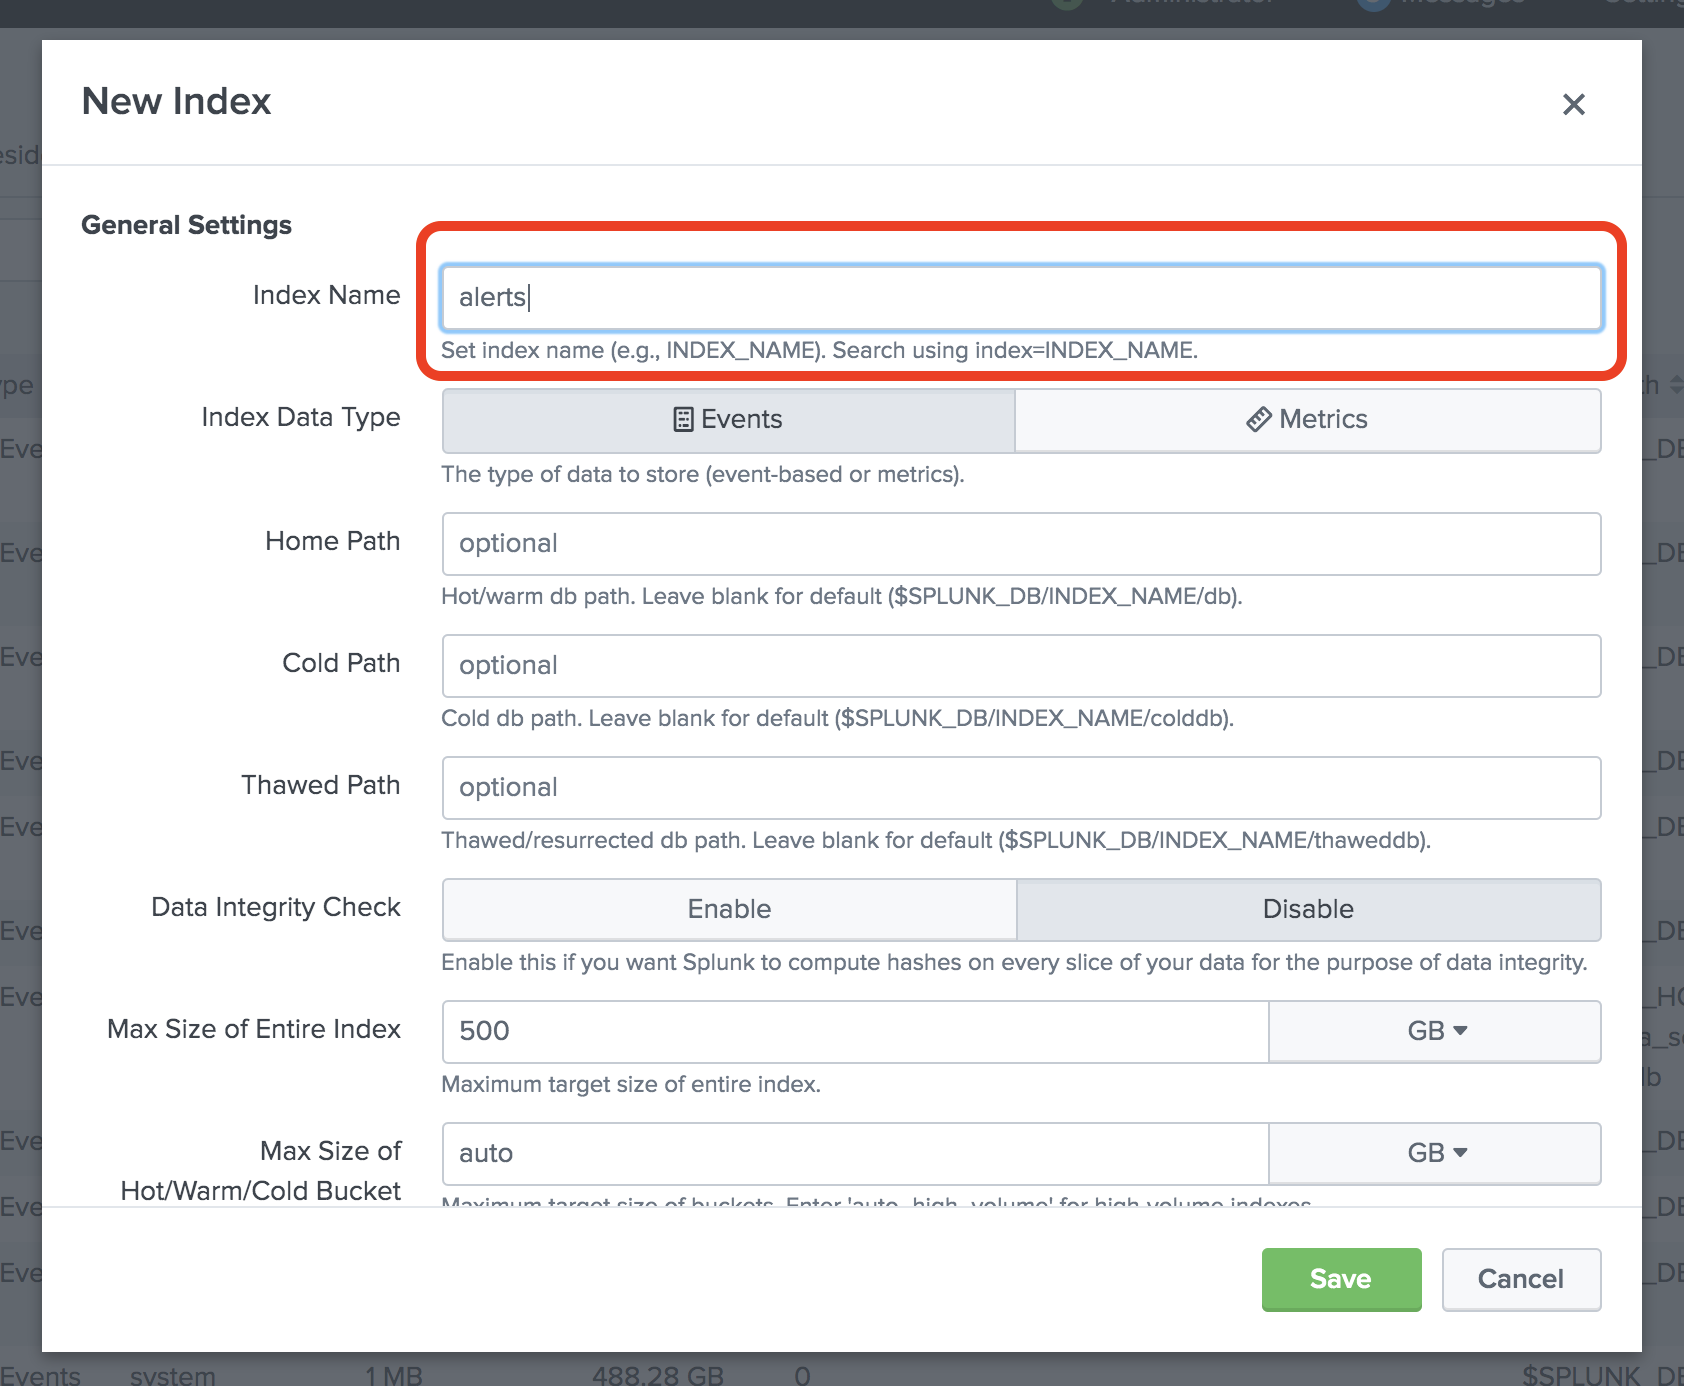
Remember to create the 'alerts' index too. (Settings -> indexes)
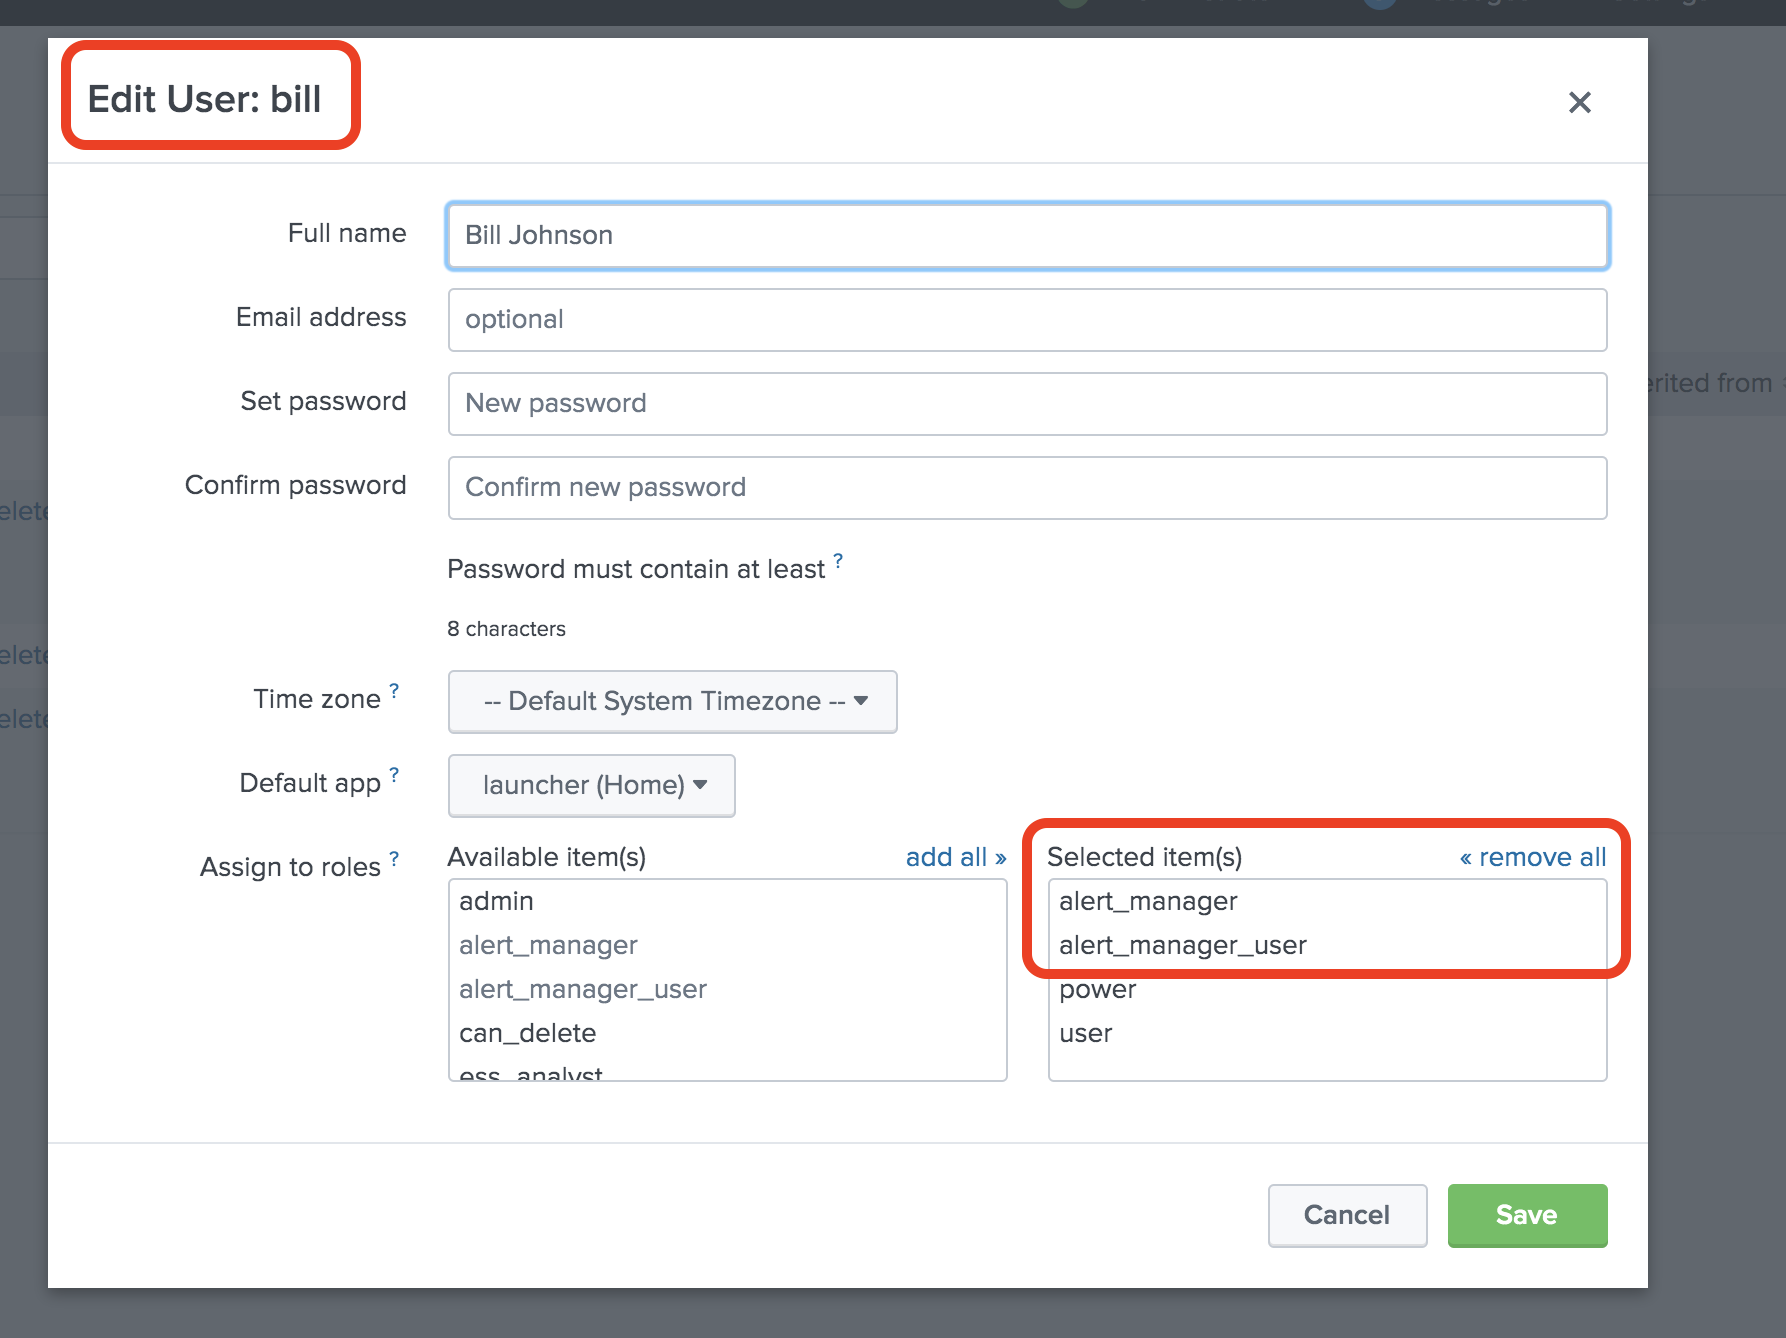
Once initial setup is, you need to add users to the alert manager roles. (Settings -> Access Controls -> Users)
Thats about it! You can tweak much more, but this should get you up and running with Alert Manager!
SMFS Setup Wizard
Version 1.3.0 onwards ships with a new improved setup wizard that guides you through the things needed to get the app up and working. On initial installation of the app, you will be directed to the setup wizard (and will continue to be directed to it until the setup has been ran through) that guides you through the required setup steps.
Broadly, the steps needed are;
1. App dependency check. Initially the setup wizard checks that all dependancies have been installed. (see dependancies section of this doc for more info).
2. Technology Add-ons Technology add-ons are required so that Splunk can understand how to create the required fields (amongst other things), from specific technologies you may employ in your environment. This screen is an attempt to guide you ito the right add-ons on apps.splunkbase.com for your technology.
NOTE: This is just my first stab at this - If you don't see your specific technology, just go to apps.splunkbase.com and search for it manually. Otherwise select your technology from the dropdown list and use the link provided to download and install if you have not already done so before installing this app.
3. Event Types This is the single most important step in configuring and running SMFS (followed by required fields provided by technology add-ons or manually extracting fields). Every dashboard and dashboard tab relies on event types and is how Splunk finds where the data is being stored on your specific system. You need to configure each link with the index and sourcetype (only).
Example: You have a fortigate firewall, have installed TA-fortigate, and can see that data coming into Splunk in the 'main' index, with a sourcetype of 'fortinet'. To configure SMFS to make use of this data simply click on the Firewall link and enter;
index="main" sourcetype="fortinet"

Then click 'save'.

if you have multiple firewalls or multiple index or sourcetypes for data you can expand your search with OR statements like

(index="main" sourcetype="fortinet") OR (index="someother_index" sourcetype="cisco:asa")
4. Field Extractions Once Splunk can find the relevant data, and you have the right technology add-ons installed, you should by default have all of the field names that the app relies on. This section checks the data you have, and tests whether or not the required fields names exist. If they do not, you either need to install the add-on, and make sure the sourcetypes in the add-on match the sourcetype you send the data with, or extract the fields manually.
NOTE: If you don't know how to do this, simply follow the tutorials youtube video in the tutorials dashboard.
Fields that have not been extracted correctly will show in dashboard tables colour coded in red (ish) and be listed 'unknown'. To fix this issue, simply extract the field correctly.
5. Asset Information Add the relevant IP addresses, NT Host, and fully qualified domain name for key infrastructure where possible, and the detection searches will (if appropriate), make use of this information. As an example, detecting web traffic that 'should' go via the web proxy requires that the app knows what the web proxy is called and/or its IP address, depending on how it looks in your logs. Click 'Add Row' to include multiple entities for each infrastructure type.
6. Detection Searches In its default state SMFS ships with a number of saved detection searches that you may or may not want to enable right out of the gate. If you do want to do this, check the right searches, and make sure you have a tick that denotes Splunk can see the data required to make the search useful to you. If you don't understand the intend behind the search, simply click next through the page and use the detection playbooks dashboard instead.
Once you click finish the app should be in a working state for the event types you have specified.
NOTE: On the first day you may notice some dropdown search boxes display an error message. This is because the LOOKUP-GEN searches have not yet ran. Either go to Settings -> Searches, filter and run LOOKUP-GEN searches or wait until the following day (they run at midnight by default).